PPT Science Experiment
Thu Feb 03, 2005 3:00 am
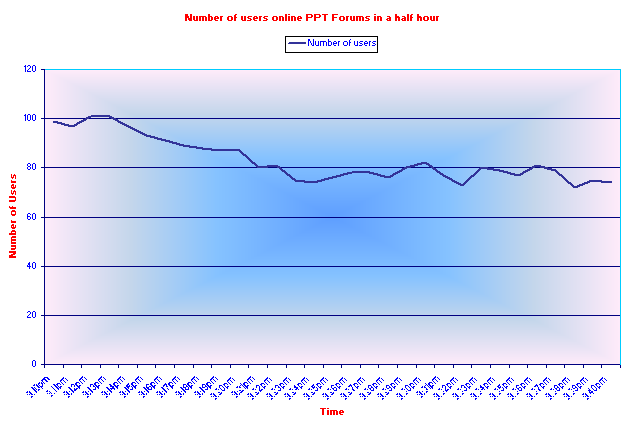
I used up a half hour of my life (9:10pm to 9:40pm) to make this chart.
The times at the bottom are hard to read, but its minute by minute.
Its a chart on how many people are on PPT.
I conclude from it that the later in the day it gets, the less people are on.
http://img.photobucket.com/albums/v13/B ... lfhour.png
The times at the bottom are hard to read, but its minute by minute.
Its a chart on how many people are on PPT.
I conclude from it that the later in the day it gets, the less people are on.
http://img.photobucket.com/albums/v13/B ... lfhour.png
Thu Feb 03, 2005 3:17 am
Perhaps you want to do an entire week, or factor in the fact there are timezones 
Thu Feb 03, 2005 3:42 am
A little advice that could help you with this and future science projects:
1. Longer time span, probably a day would be good.
2. Record it for every half hour or so, not every minute.
3. Take data for multiple days and find averages.
4. Take into account weekends, holidays, time zones, downtimes on Neopets, etc.
Hope that helps! Personally, I've noticed that everyone is usually on after my supper-time, about 8:00-10:00 PM EST.
It's an interesting project though...if you put a little more effort into it maybe we can use it for something, like SL will use it to figure out the best times to take the site down or something.
1. Longer time span, probably a day would be good.
2. Record it for every half hour or so, not every minute.
3. Take data for multiple days and find averages.
4. Take into account weekends, holidays, time zones, downtimes on Neopets, etc.
Hope that helps!
It's an interesting project though...if you put a little more effort into it maybe we can use it for something, like SL will use it to figure out the best times to take the site down or something.
Thu Feb 03, 2005 5:37 am
Nice chart you've got there! Are you going to go all the way and record data every half hour? Thus giving you approximatly... 25 minute sleep breaks?
Thu Feb 03, 2005 6:25 am
Ooooh. Another random statistician is in the ranks eh?
Me likey
Me likey
Thu Feb 03, 2005 4:11 pm
peaking at 100 people.
not very many by all accounts is it.
not very many by all accounts is it.
Thu Feb 03, 2005 4:57 pm
Hmm thats really cool looking. It would probably be more interesting to get a daily chart or something like that recorded every half hour or so. It would just take a dosen or so pinkpters recording how many people are on every half hour while they are no themselves, and wed probably get every half hour.
Thu Feb 03, 2005 6:22 pm
Cool! If you want me to, I can help you when you can't get on.
Sun Feb 06, 2005 12:30 am
Wow. That's awesome. It seems really like there's more users on, by your graph, then really post very often. O_o
I don;t make sense, though, so ignore me.
I don;t make sense, though, so ignore me.
Sun Feb 06, 2005 1:20 am
ScottNak wrote:Ooooh. Another random statistician is in the ranks eh?
Me likey
You two need to fight to the death now!
Sun Feb 06, 2005 1:21 am
This is very interesting.
You know? First, I thought it was the whole day. xD
You know? First, I thought it was the whole day. xD
Sun Feb 06, 2005 2:24 am
This is a neat idea, I always sort of wondered whether there was a pattern to how many people were on when. I think if you kept this project going for say a week and recorded it every hour or so we could get some interesting results.